Cargando...
Recursos educativos
-
Nivel educativo
-
Competencias
-
Tipología
-
Idioma
-
Tipo de medio
-
Tipo de actividad
-
Destinatarios
-
Tipo de audiencia
-
Creador
Lo más buscado
-

Climate change predictions for Spain
V&V Books Vicens Vives Organización
- 1 lo usan
- 1516 visitas
Graphs of regionalized projections of climate change in Spain for the 21st century
-
Website: ChartGo
Tiching explorer Organización
- 1 lo usan
- 3012 visitas
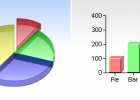
This tool allows us to create bar graphs, line graphs or pie charts. We choose the settings, paste our data in the chart data area, and hit the create button.
-

Website: StatSilk
Tiching explorer Organización
- 1 lo usan
- 1994 visitas
This webpage offers a range of web-based and desktop software to create interactive maps and graphs.
-
Website: Create a Graph
Tiching explorer Organización
- 2242 visitas
This website provides an online web tool in which we can create graphs to communicate information visually.
-

Interpret. Coal and steel production
EduBook Organización
- 1622 visitas
How did the production of coal and steel grow? Interpret the graphs. → from...to..., rose steadily/gradually/sharply...,
-

Describe. European temperate landscapes
EduBook Organización
- 1600 visitas
Using the photographs and graphs, explain the characteristics of the three types of temperate climate in Europe.
-

Final self-evaluation 04 - The Earth's climate zones
EduBook Organización
- 1318 visitas
Look at the following climate graphs and match them with one of the Earth's climate zones:
-

Website: DIY chart builder
Tiching explorer Organización
- 1 lo usan
- 2567 visitas
DIYchart is a web-based tool that allows us to create interactive charts and graphs from static or dynamic data. It's free but we need to register first.
-

Website: Infogr.am
Tiching explorer Organización
- 1 lo usan
- 1857 visitas
This website provides an interactive tool that allows us to create interactive charts and graphs. It's free but first we need to register.
-
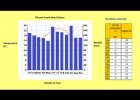
How to make a Climate Graph
V&V Books Vicens Vives Organización
- 465 visitas
Climate graphs are useful for identifying climate patterns in a location. They consist of a blue bars graph representing rainfall for each month of the year ...


Te estamos redirigiendo a la ficha del libro...
